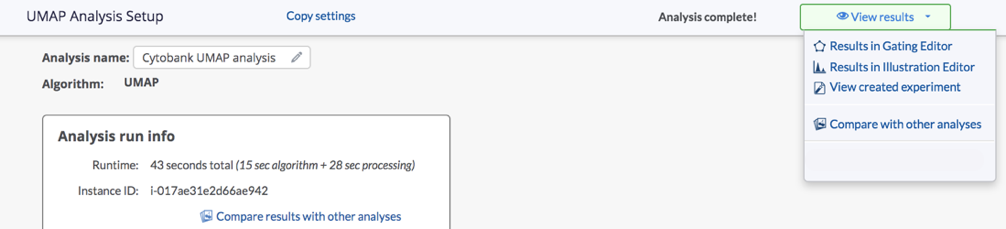
Once an open dimensionality reduction (DR) algorithm analysis is successfully finished, it will be directed to the analysis complete page where you can view the run info and the algorithm settings. You can also access the page from the Settings tab from the blue navigation bar within your DR experiment.

On the completed DR analysis settings page (except the viSNE settings page), you will see the Analysis run info window. For tSNE-CUDA and UMAP, it shows the runtime, and the DR map with the DR channels as X and Y axes. For opt-SNE, it shows runtime, actual iterations performed, iterations performed in early exaggeration and the final KL divergence. This run info can help evaluate the map quality. You may check out the articles on map quality and fine tuning the advanced settings of the DR analysis to find more info on optimizing the DR analysis.
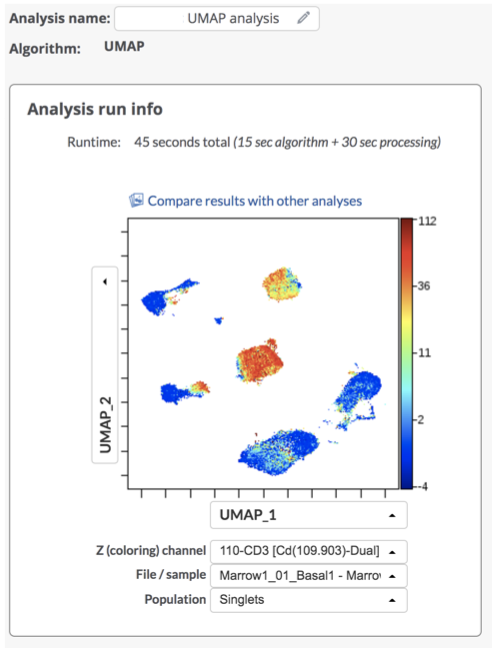
(UMAP analysis run info window)
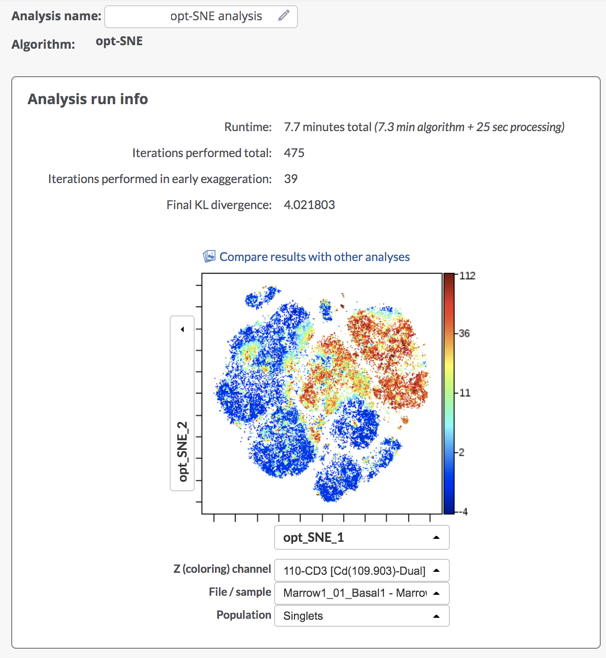
(opt-SNE run info window)
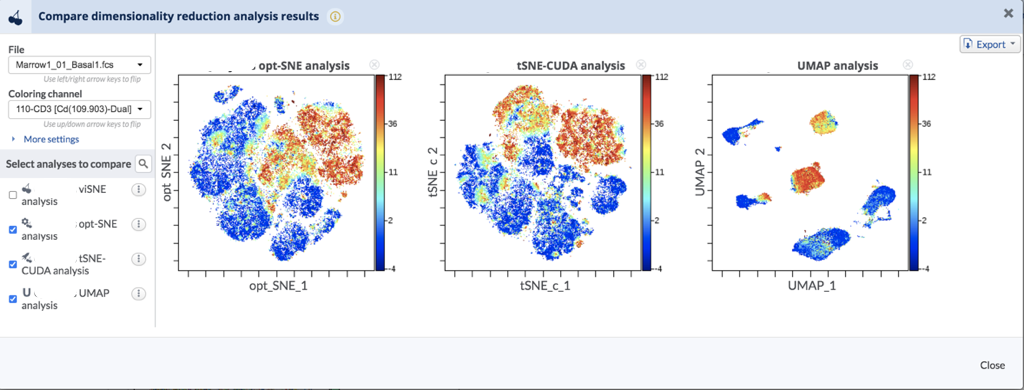
Within the Analysis run info window, you can also click on Compare results with other analyses to launch the Compare dimensionality reduction analysis page, where you can compare the results between different DR algorithm runs on the same parent experiment. On the left pane, you can choose viewing options. You can select File and Coloring channel. There is also an option to Zoom in or out, Palette, Dot plotting methods as well as Background color to be White or Black. All your DR analyses from that experiment will be listed on the bottom left, and you can check the box to add them to the comparison window. You can use up/down arrow key to navigate through the coloring channel to view the marker expression within the different DR maps showing on the right. By comparing the results between different DR analysis, it can help to determine 1) If all algorithms give comparable results and if they ran at optimized settings, and 2) If one algorithm is better than others at showing your results.
Below the Analysis run info window is the algorithm settings. It shows the population, file and channel setup as well as the advanced settings for that run.
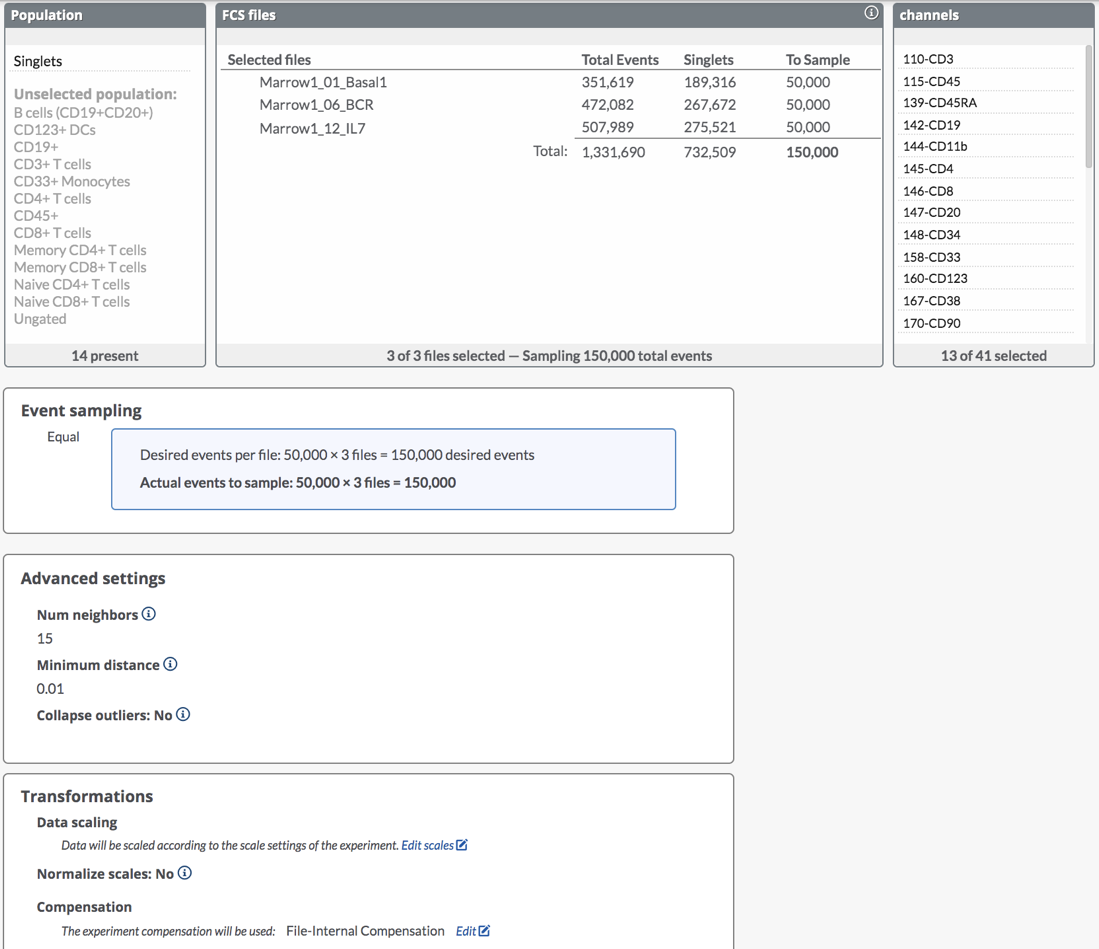
(example of the UMAP settings)
You can click on Copy settings to launch a new analysis with the same settings. It is an easy way to launch a new analysis based on a previous selection and optimize your settings from there.
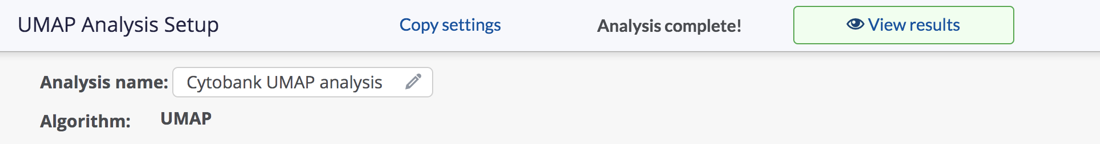
You can also click on View results to view results in Gating Editor, Illustration Editor, and the created experiments will direct you to the Experiment Summary page. Compare with other analyses window can also be launched from here.