
If your data are off the plot, bunched on an axis, piled on the edge of the plot, or otherwise don't look correct, the scales for the Cytobank experiment may need to be adjusted.
Scales settings can be customized by using the Scales Editor in any Cytobank experiment:
There is only one version of scales in a Cytobank experiment at any given time. If the scales within an experiment change, then all saved illustrations that depend on those scales will also change.
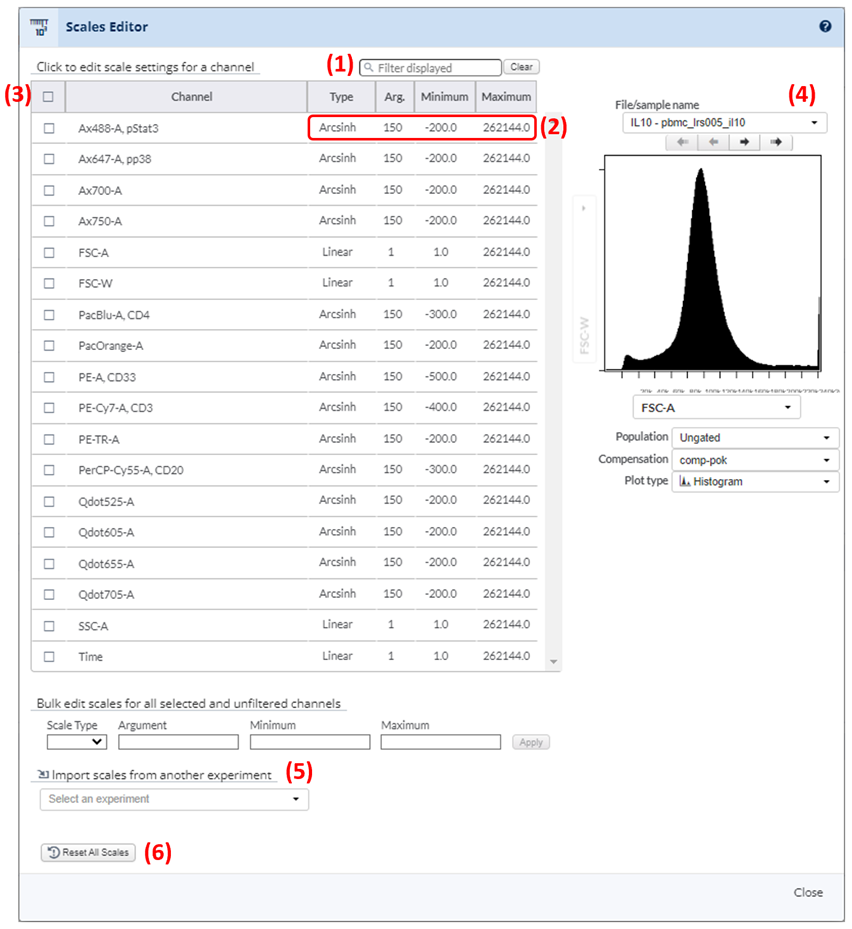
1) Filter displayed scales by character string.
2) To modify any value within a field within the Scales Editor, simply click on it. When done editing the field, press the return key on your keyboard or click outside of the field to finalize your changes.
The Cytobank platform offers three ways / equations to scale your data:
- Linear (raw data values unchanged from sample)
- Log (data are transformed by base 10 logarithm)
- Arcsinh (learn more)
The Cytobank platform will automatically set scale equation for most channels to Arcsinh for data produced by most modern cytometers. Older cytometers that produce data without negative values may be viewed in Log. Some data may be set to linear scale mode by default, which in many cases will need to be adjusted in the scale editor to a different scale equation. We generally recommend Arcsinh.
3) Select multiple channels to bulk edit the scales.
4) Plot to visualize the scales settings effect.
5) Import the scales from another Cytobank experiment.
6) Reset the scales to the default ones of the experiment.
For further reading on the optimal setting of scales, check out our blog post on how to scale cytometry data effectively.
*For Research Use Only. Not for use in diagnostic procedures.