
A SPADE tree can be visualized with different metrics.
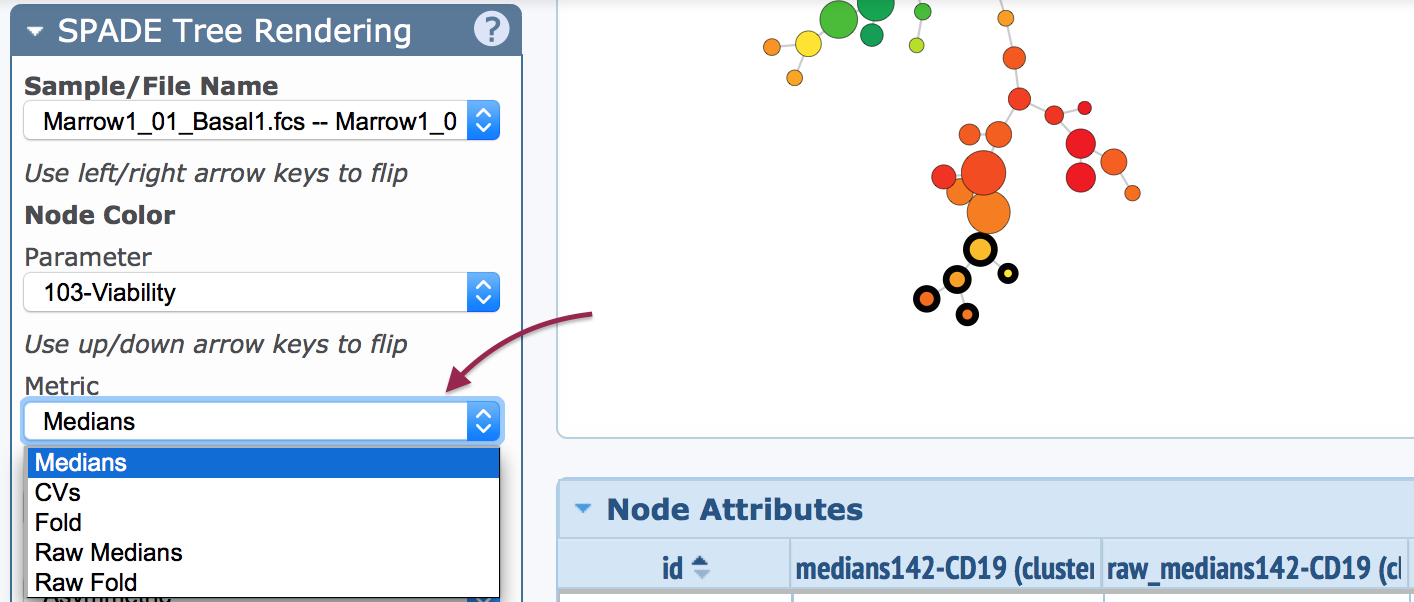
The way in which the SPADE tree is colored, and the statistics correlating to the colors, will change depending on the selected metric. The five different metrics are explained below:
Raw Median
The data are reported and displayed with the same values as present in the FCS files, without transformation.
Median (actually the transformed median)
The data are reported and displayed with transformed values according to the scale settings in the Cytobank experiment.
These numbers will generally be smaller (<10), because transformation happens in a log-like fashion.
Raw Fold
"Raw Fold" is simply a linear ratio. When the Metric is set to "Raw Fold", the following calculation takes place in SPADE:
(NodeValue/Baseline) = "Raw Fold"
Example:
Suppose node number 142 in your stimulated sample has a raw median of 200 in a particular channel, and node number 142 in the baseline sample has a raw median of 52 in the same channel. The following calculation happens...
(200/52) = 3.85 <-- that's the raw fold-change value that will be displayed on your color scale
Fold (actually the transformed ratio of medians)
In SPADE, when "Metric" is set to "Fold", it means the fold change is being calculated in a transformed ratio manner. The value is calculated as follows:
[transformed median of stimulated node] - [transformed median of unstimulated node] = "Fold" ...which is more accurately called "arcsinh ratio" or "transformed ratio".
Example:
Suppose node number 142 in your stimulated sample has a raw median of 200 in a particular channel, and node number 142 in the baseline sample has a raw median of 52 in the same channel. Also, the scale equation of the channel is arcsinh and the scale argument of that channel is 5. The following calculation happens...
asinh(200/5) - asinh(50/5) = 4.38 - 3.00 = 1.38 <-- that's the fold change value that will be displayed on your color scale
Multiple baselines
Suppose you had chosen multiple "baseline" files. In that case, you still only have one "stim" median, which is 200. But you have multiple "basal" medians -- let's suppose they are 30, 40, and 50. In this case, SPADE calculates the fold change relative to the average of the transformed medians. So that's:
asinh(200/5) - [asinh(30/5) + asinh(40/5) + asinh(50/5)]/3 = 4.38 - [2.49 + 2.78 + 3.00]/3 = 4.38 - 2.76 = 1.62
The same principle for multiple baseline applies to raw fold as well, but following the rules of raw fold math.
CV
CV (coefficient of variation) is given by the standard deviation of transformed events divided by the average of transformed events, times 100. This metric is given on the basis of the contents of a single node only.
Notes on fold of event count or percent of total
Two useful statistics available per node are event count and percent of total. On occasion it may be desired to use these statistics to report a fold change ratio between samples. However, when these statistics are selected, the metric menu is not clickable:
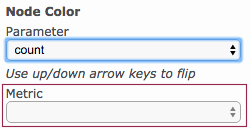
(with count or percent of total selected as parameter, metric gives no options)
SPADE doesn't currently offer the ability to visualize fold of percent of total or event count. These parameters can only be visualized in their raw form. The closest proxy to this functionality is to use the parameter percenttotalratiolog. This parameter reports the base 10 log of the fold of the percent of total values. I.e. log10(percent of total sample / percent of total baseline). No metric is able to be chosen with this parameter because it is implied within the parameter itself.
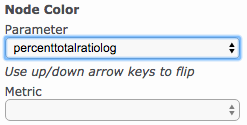
(percenttotalratiolog selected as a proxy for fold of percent of total)
For true fold of event count, bubbles can be exported to a new experiment. The fold change of event count can then be analyzed in the Illustration Editor of the child experiment (learn more).
To request fold change of event count or percent of total within the SPADE interface, write to Cytobank Support.