
In a paired experimental design, the individual subjects in a study might be tested at two different timepoints, or by two different methods. For example, samples were collected from each individual before and after treatment. If your experiment utilizes a paired design, you can use a paired statistical significance test to get the most sensitivity to detect differences between pre- and post-treatment after properly annotating each file’s Sample Tags.
The parametric paired student’s t-test or non-parametric Wilcoxon signed-rank test are available to perform paired analysis. Both tests take advantage of the annotations of experimental variables in the experiment’s Sample Tags to automatically identify which samples to pair, so you must annotate your data with all the necessary information to uniquely identify each file prior to running a paired test. This article will review:
Examples
The pairing logic will look at all annotated Sample Tags to identify which one should be used to determine sample pairing. Here is how it works in some common scenarios.
Compare timepoints paired by individuals
In many cases, samples are paired for testing by individuals where there are repeated measurements taken on each individual subject. If your study has a paired design where samples were taken from the same individuals at two different timepoints, you may use the Plot and Illustration Layout settings as shown below, selecting a Paired student’s t-test as the Statistical test, and Timepoints as the I.V. Note that you need to create sample tags for “Individuals” before setting up this layout.
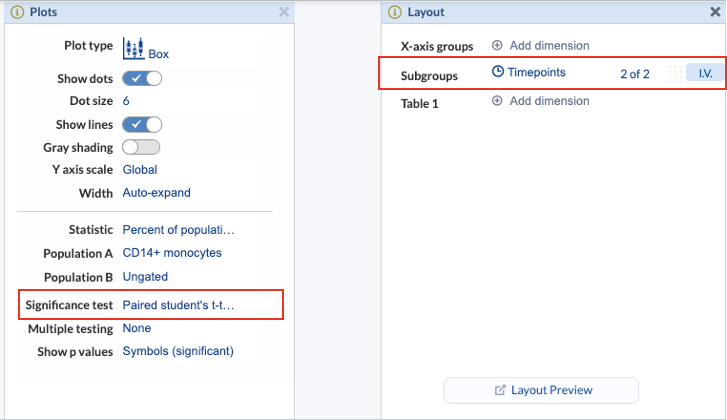
(Left) Plot settings for setting up a Paired student’s t-test to compare percent of CD14+ monocytes of total cells (Ungated). (Right) Layout settings to compare Timepoints
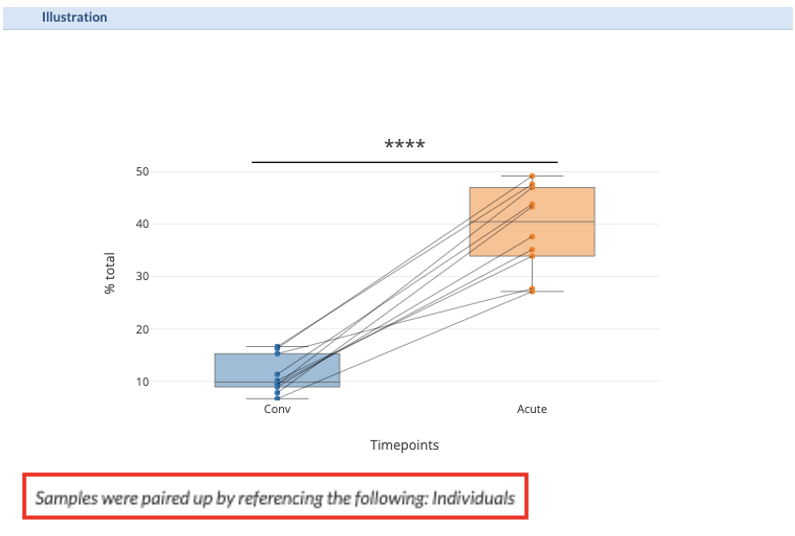
Boxplot showing result of Paired student’s t-test comparing the percent of CD14+ monocytes of total events in samples taken at the convalescent (Conv) and acute timepoints. Each point, connected by a line, represents an individual. Asterisks denote statistical significance at p < 0.0001. Message in the bottom-left corner indicates which Sample Tag was used to determine how to pair samples for statistical testing.
The resulting plot shows a statistically significant difference between the percent of the selected population, CD14+ monocytes, between the two timepoints, acute and convalescent. The message in the bottom left corner of the plot shows how your samples were paired. Note that you should not select the pairing variable (individuals) anywhere in the Plot or Layout settings; this variable will be automatically identified from among the dimensions that are not selected for display.
Compare parameters paired by FCS files
In this experiment, showing selected data from Michlmayr et al. (2018)1, immune profiling was performed, including measuring a viral protein during Chikungunya virus infection. To use a paired statistical test to compare the expression of the viral protein across two populations, samples will be paired by FCS file. If Populations are the only dimension selected as X-axis group or Subgroups, pairing will be done by FCS file.
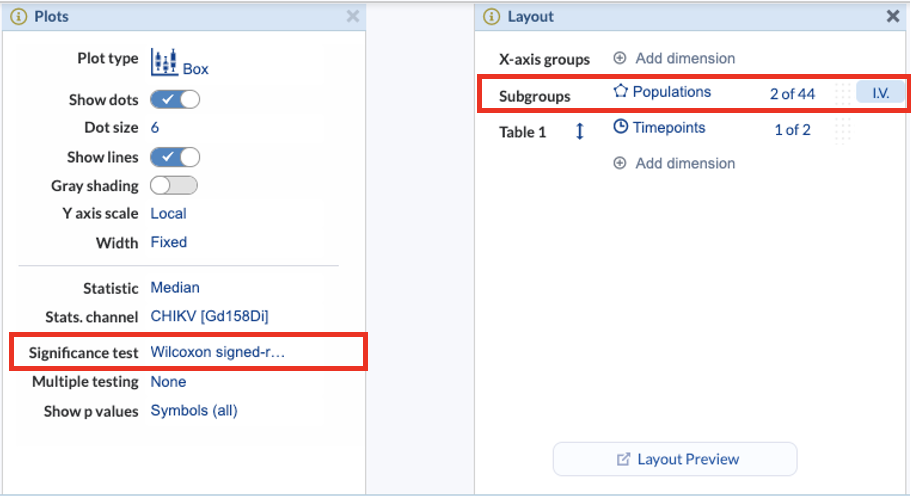
(Left) Plot settings for setting up a Wilcoxon signed-rank test to compare CHIKV median . (Right) Layout settings to compare Populations within samples corresponding to one Timepoint
Note that if you enable lines on a plot, the samples that are paired are connected by lines. Hovering your mouse over each point will show the FCS filename, which can be used to verify the pairing scheme.
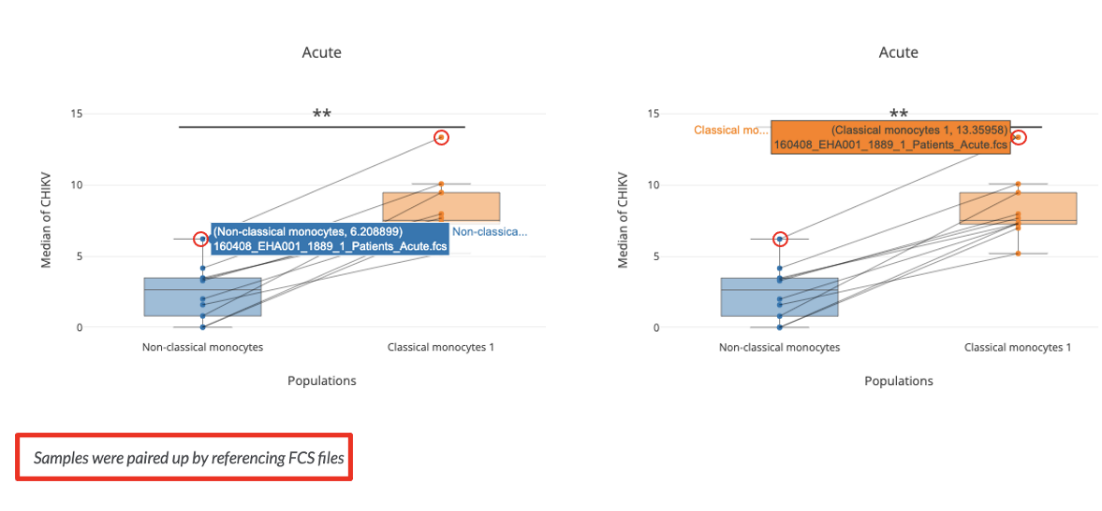
Boxplot showing result of Wilcoxon signed-rank test. Hovering the mouse over the data points shows additional information on the identity of that data point. The topmost points connected by a line belong to the same FCS file, which was used for pairing to compare populations.
Troubleshooting
If the pairing message shows a different pairing variable than you expected, or shows a warning message, check your experiment’s Sample Tags to ensure each sample has a unique annotation.
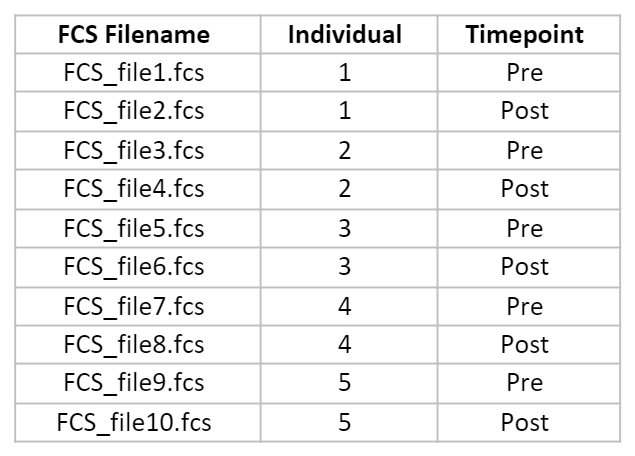
The design of a completely annotated experiment with no missing files may have Sample tags like this, with 10 FCS files, collected from 5 Individuals that each have samples available for two (2) Timepoints.
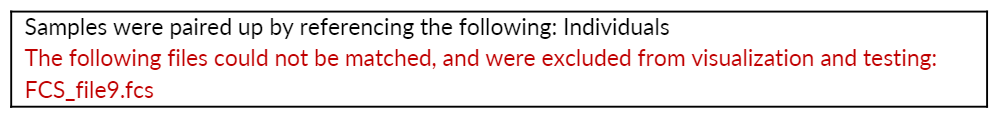
The pairing determination can accommodate a small number of missing files. For example, If FCS_file10.fcs is missing (Individual 5, Post), Individuals 1, 2, 3, and 4 will still be paired. However, since FCS_file9 (Individual 5, Pre) is missing its paired file, FCS_file10 (Individual 5, Post), this file will be omitted from the illustration and from statistical testing. You will see a message on the illustration:
If too many samples are missing, the pairing variable may not be able to be identified automatically. A message will appear in the illustration:
![]()
In this case, you may not have enough files to identify pairing, in which case, you can run an unpaired statistical test. Or, you may need to re-configure the experiment’s Sample Tags if there are any annotations missing. To easily view Sample Tags across all dimensions simultaneously, see the FCS files section of the Experiment summary page, or download Sample Tags to view and edit them in a table format. Please Contact Support if you need more assistance in setting up a paired test.