
Background
The Export statistics tool allows the creation of templates used to export batches of statistics from all files within an experiment.
Remember that it is also possible to export statistics directly from the export statistics directly from the Illustration Editor.
If you want to follow along, look for the public Experiment called PBMC Experiment (fluorescence) or something similar on the Cytobank server on which you have an account. This Experiment is used below as an example.
The templates used in the export statistics tool can be saved and loaded later into any Experiment, so long as the template makes sense for that Experiment. Templates may also be shared between users on the same Cytobank server or moved between Cytobank servers.
Finding and using the Export statistics tool
To enter the export statistics tool, first navigate into an Experiment and go to Actions > Export > Export statistics.
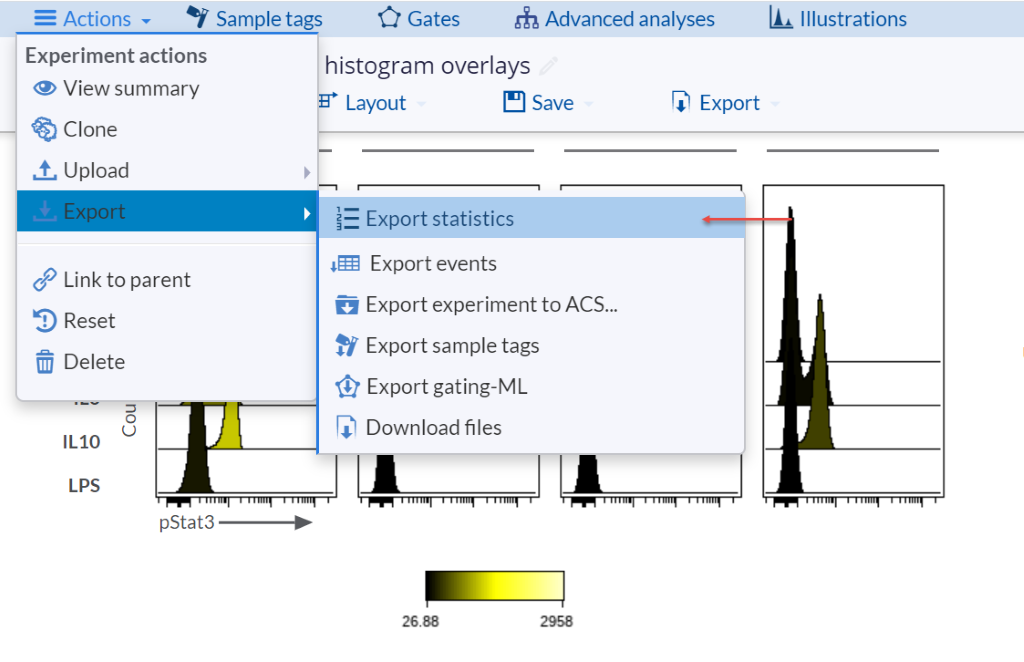
(navigating to the export statistics tool)
Upon entering the tool, navigate to Settings Templates to select either a previously saved personal template or, if available, a public template generated by your site admin. It is also possible to Import from file a previously saved statistics template from a file saved on your computer. Alternatively, the option to define a new template from scratch can be chosen. Templates can also be saved and loaded at any time by selecting Save template underneath the Settings Templates on the top of the Export experiment statistics page.
![]()
(click to load a saved template, or define a new one)
A template is populated with export definitions that become rows in the view at the bottom. Each row is a piece of information (generally statistics) that will be pulled from every file in the Experiment. Besides statistics, Sample Tag information and FCS file metadata can be extracted from the Experiment into the spreadsheet. This is beneficial for maintaining scientific context for your statistics upon import into another tool such as Prism, Spotfire, Excel, Tableau, etc., instead of just being limited to FCS file names.
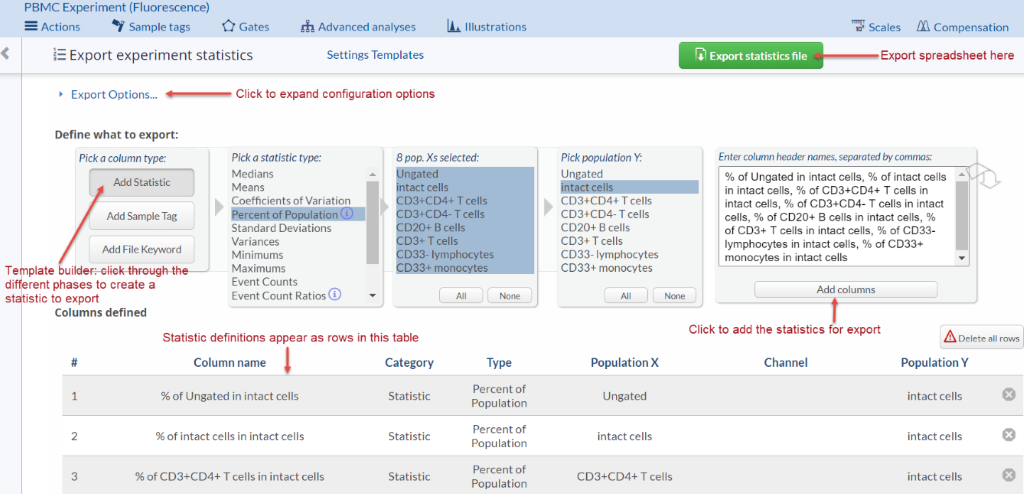
(basic anatomy of the export statistics interface)
Video overview of the Export statistics tool
The movie below demonstrates the use of the Export statistics tool. Note the ability to select Sample tag as well as FCS file metadata for export. Also, observe the ability to batch and multi-select statistics as well as drag and drop export statistics template rows to rearrange as desired.
Example exported spreadsheet result
As mentioned above, each row is a piece of information that will be pulled from every file in the experiment. For example, if an experiment with 10 files has an export template with 10-row definitions, a 10 x 10 spreadsheet with 100 data points will result. For smaller situations such as the one demonstrated in the video above, a spreadsheet such as the one below will result:
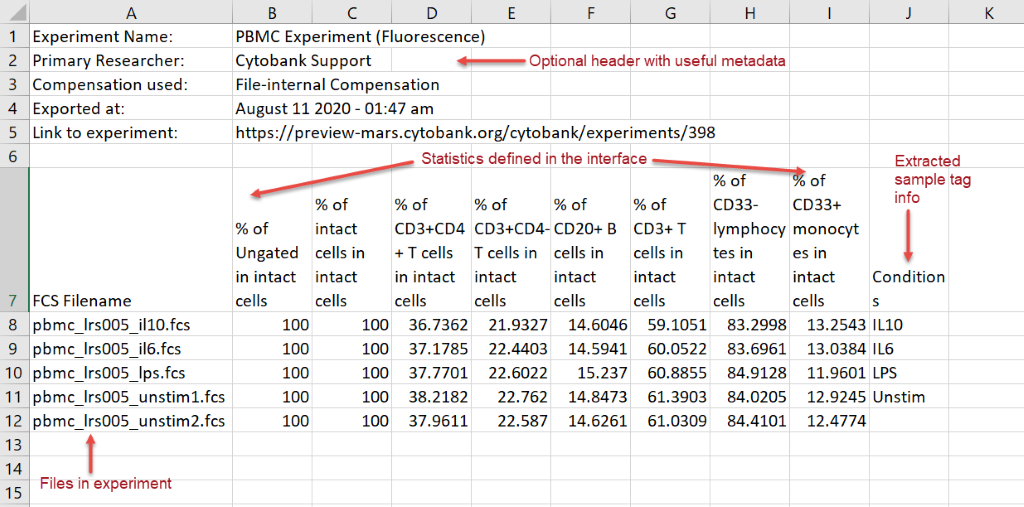
(the spreadsheet that results from the export in the movie above)
Have more questions? Submit a request
Beckman Coulter, Inc. All rights reserved. Beckman Coulter, the stylized logo, and the Beckman Coulter product and service marks used herein are the trademarks or registered trademarks of Beckman Coulter, Inc. in the United States & other countries.
All other trademarks are the property of their respective owners.